


Top Kubernetes Monitoring Tools to Keep Your Cluster Healthy

by Tim
December 3, 2025
Kubernetes (K8s) has become a key tool for managing containerized applications, but keeping these clusters running smoothly needs careful monitoring. Effective Kubernetes monitoring tools can give you important insight into your cluster’s performance, helping you spot bottlenecks, fix problems, and make sure your applications are always available. This article will examine some of the best open-source and commercial Kubernetes monitoring tools that can help maintain the health of your K8s environment.
“`
Key Takeaways
- Kubernetes monitoring is crucial for maintaining the health and efficiency of containerized applications, but its dynamic and distributed nature presents unique challenges.
- Key features of effective Kubernetes monitoring tools include real-time data visualization, alerting, historical data analysis, log aggregation, and integration with other DevOps tools.
- Prometheus, Grafana, and the ELK Stack are popular open-source Kubernetes monitoring tools, each with strengths in metrics collection, data visualization, and log management, respectively.
- Commercial Kubernetes monitoring solutions like Datadog, New Relic, and Dynatrace offer automated discovery, AI-driven insights, and enterprise-level support for complex environments.
- Best practices for Kubernetes monitoring include defining KPIs, setting up alerts, automating tasks, and integrating monitoring with CI/CD pipelines to ensure optimal resource utilization and application performance.
- Kubegrade simplifies Kubernetes management and integrates with various monitoring tools, enabling secure, adaptable, and automated K8s operations.
- Choosing the right Kubernetes monitoring tools depends on specific needs and requirements, with both open-source and commercial options offering distinct advantages.
Table of Contents
- Introduction to Kubernetes Monitoring
- Key Features to Look for in Kubernetes Monitoring Tools
- Top Open-Source Kubernetes Monitoring Tools
- Leading Commercial Kubernetes Monitoring Solutions
- Best Practices for Implementing Kubernetes Monitoring
- Conclusion: Choosing the Right Kubernetes Monitoring Tools for Your Needs
- Frequently Asked Questions
Introduction to Kubernetes Monitoring

Kubernetes (K8s) is a system for automating deployment, sizing, and management of containerized applications. It groups containers that make up an application into logical units for easy management and discovery. Keeping watch is vital to keep a Kubernetes cluster healthy and efficient. Without proper oversight, issues can go unnoticed, leading to performance degradation or even application outages.
Keeping watch on a Kubernetes environment presents unique challenges. Kubernetes is constantly changing, with containers and services constantly being created, destroyed, and sized. This makes it difficult to keep track of everything that’s happening in the cluster. The distributed nature of Kubernetes adds another layer of complexity, as applications are spread across multiple nodes and networks.
Many Kubernetes monitoring tools are available, each with its own strengths and weaknesses. These tools range from open-source solutions to commercial platforms, offering features such as real-time dashboards, alerting, and historical data analysis. Choosing the right tools depends on the specific needs and requirements of the cluster.
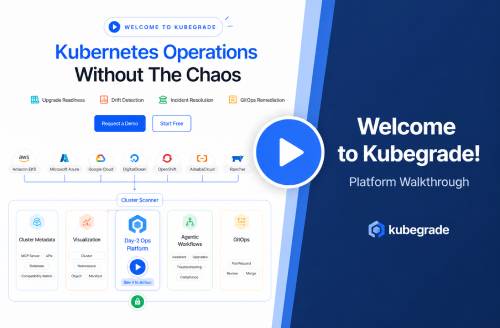
Kubegrade simplifies Kubernetes cluster management. It’s a platform for secure, adaptable, and automated K8s operations, enabling monitoring, upgrades, and optimization.
“`
Key Features to Look for in Kubernetes Monitoring Tools
Effective Kubernetes monitoring tools share several key features. These features enable users to maintain a healthy and well-performing cluster. When comparing Kubernetes monitoring tools, consider the following aspects:
- Real-time Data Visualization: The ability to see what’s happening in the cluster in real time. This includes metrics like CPU usage, memory consumption, and network traffic. Real-time dashboards help quickly identify bottlenecks or anomalies. For example, a sudden spike in CPU usage on a node could indicate a problem with one or more pods running on that node.
- Alerting and Notifications: Forward-thinking alerting is vital. The monitoring tool should be able to send notifications when certain thresholds are breached. For instance, an alert could be triggered when a pod’s CPU usage exceeds 80% or when a service becomes unavailable. These alerts enable quick response to issues before they impact users.
- Historical Data Analysis: Analyzing historical data helps identify trends and patterns. This information is useful for capacity planning and performance tuning. For example, historical data might show that a particular service experiences increased traffic during certain times of the day.
- Log Aggregation: Centralized log management is vital for troubleshooting. Kubernetes monitoring tools should aggregate logs from all containers and services in the cluster. This makes it easier to identify the root cause of problems. For example, if an application is crashing, the logs might contain error messages that point to the source of the issue.
- Integration with Other DevOps Tools: Integration with tools like Prometheus, Grafana, and Slack can improve the monitoring workflow. For example, integrating with Prometheus allows you to collect metrics from Kubernetes, while Grafana provides data visualization capabilities. Integration with Slack enables you to receive alerts and notifications directly in your team’s chat channel.
These features contribute to forward-thinking issue detection and resolution. By providing real-time visibility, alerting, historical data analysis, log aggregation, and integration with other tools, Kubernetes monitoring tools allow users to keep their clusters healthy and efficient.
“`
Real-Time Data Visualization
Real-time data visualization is important in Kubernetes monitoring. Visual representations of metrics through dashboards and graphs enable users to quickly spot performance bottlenecks and unusual activity. Instead of sifting through logs or command-line outputs, users can see the state of their cluster at a glance.
Key metrics to visualize include:
- CPU usage: Tracks the amount of processing capacity being used by pods and nodes.
- Memory consumption: Monitors how much memory pods and nodes are utilizing.
- Network traffic: Shows the volume of data being transmitted and received by the cluster.
- Disk I/O: Measures the rate at which data is being read from and written to disk.
- Application-specific metrics: Displays metrics unique to the applications running in the cluster, such as request latency or error rates.
Effective dashboards often use a combination of visualization techniques, such as:
- Graphs: Line graphs for time-series data, bar graphs for comparing values, and pie charts for showing proportions.
- Gauges: Display a single value within a range, often used for metrics like CPU utilization.
- Heatmaps: Visualize data density and patterns across a matrix.
Tools like Grafana are commonly used to create custom dashboards that display Kubernetes metrics. These dashboards can be adjusted to show the most relevant information for different teams or use cases.
Data visualization is a key feature of Kubernetes monitoring tools. It provides a clear and understandable view of cluster performance, enabling users to identify and resolve issues in advance.
“`
Alerting and Notifications
Alerting and notifications play a key role in forward-thinking Kubernetes monitoring. By setting up alerts, operators can be notified immediately when problems arise, allowing them to take action before those problems escalate.
Alerts are typically set up based on predefined thresholds. When a metric exceeds a defined limit, a notification is triggered. For example:
- High CPU usage: An alert could be set to trigger if a pod’s CPU usage exceeds 90% for more than five minutes.
- Low memory: An alert could be triggered if a node’s available memory drops below 10%.
- Application errors: An alert could be set to trigger if the error rate for a service exceeds a certain threshold.
Notifications can be sent through various channels, including:
- Email: A simple way to receive alerts, suitable for non-urgent issues.
- Slack: Allows teams to collaborate on resolving issues in real time.
- PagerDuty: A dedicated alerting service that ensures critical alerts are acknowledged and acted upon.
Kubernetes monitoring tools should provide customizable alerting features. This allows users to define alerts that are specific to their environment and application requirements. Effective alerting and notifications enable a quick response to critical issues, minimizing downtime and maintaining application performance.
“`
Historical Data Analysis
Historical data analysis is a key aspect of Kubernetes monitoring. By examining past performance data, users can identify trends and patterns that would otherwise be invisible. This information is useful for optimizing resource utilization and improving application performance.
Collecting and storing historical data involves setting up a time-series database, such as Prometheus or InfluxDB. These databases are designed to efficiently store and query time-stamped data. The data can be retained for weeks, months, or even years, depending on the storage capacity and retention policies.
Several techniques can be used for analyzing historical data:
- Time-series analysis: Involves plotting metrics over time to identify trends, seasonality, and other patterns. For example, time-series analysis might reveal that a particular service experiences increased traffic every Monday morning.
- Anomaly detection: Uses statistical methods to identify data points that deviate significantly from the expected range. This can help detect unusual activity or performance degradation.
- Correlation analysis: Examines the relationship between different metrics to identify potential causes and effects. For example, correlation analysis might reveal a strong correlation between CPU usage and request latency.
Historical data can be used to:
- Optimize resource allocation: By analyzing historical CPU and memory usage, users can identify underutilized resources and reallocate them to other applications.
- Improve application performance: By identifying performance bottlenecks and trends, users can optimize application code, configuration, or infrastructure.
- Plan for capacity: By projecting historical trends into the future, users can estimate future resource requirements and plan for capacity upgrades.
Historical data analysis is a key feature of Kubernetes monitoring tools. It provides insights into past performance, enabling users to make informed decisions about resource allocation, application optimization, and capacity planning.
“`
Log Aggregation and Management
Log aggregation and management is vital for troubleshooting Kubernetes applications. In a distributed environment like Kubernetes, logs are scattered across different containers, pods, and nodes. Collecting and centralizing these logs simplifies the process of diagnosing issues and identifying security vulnerabilities.
Log aggregation involves collecting logs from various sources and forwarding them to a central location. This can be achieved using tools like:
- Fluentd: An open-source data collector that can gather logs from multiple sources and forward them to various destinations.
- Elasticsearch: A search and analytics engine that can be used to store and analyze logs.
- Kibana: A visualization tool that can be used to create dashboards and explore logs stored in Elasticsearch.
By centralizing logs, users can:
- Diagnose application errors: Logs often contain error messages and stack traces that point to the root cause of application failures.
- Identify security vulnerabilities: Logs can reveal suspicious activity, such as unauthorized access attempts or unusual network traffic.
- Track application behavior: Logs can provide insights into how applications are being used and how they are performing.
For example, if an application is crashing, the logs might contain error messages that indicate a configuration problem or a bug in the code. By analyzing the logs, developers can quickly identify the issue and deploy a fix.
Effective log aggregation simplifies troubleshooting, improves overall system reliability, and is often included in Kubernetes monitoring tools. It provides a centralized view of all log data, enabling users to quickly identify and resolve issues.
“`
Top Open-Source Kubernetes Monitoring Tools
Several open-source Kubernetes monitoring tools are available, each with its own set of features and capabilities. These tools provide a cost-effective way to monitor Kubernetes clusters and ensure application performance. Here’s a look at some of the leading options:
Prometheus
Prometheus is a popular open-source monitoring solution. It is very good at collecting and storing time-series data. Its architecture includes:
- Prometheus server: Scrapes and stores metrics.
- Client libraries: Instrument application code to expose metrics.
- Pushgateway: Allows short-lived jobs to expose metrics.
- Alertmanager: Handles alerts.
Strengths:
- Very good at collecting and storing time-series data.
- Supports a wide range of exporters for collecting metrics from different sources.
- Has a capable query language (PromQL) for analyzing data.
Weaknesses:
- Not designed for long-term storage of data.
- Requires some expertise to set up and configure.
Setup: To set up Prometheus for basic Kubernetes monitoring, deploy the Prometheus server in the cluster and configure it to scrape metrics from Kubernetes components. Use the Kubernetes service discovery feature to automatically discover and monitor pods and nodes.
Grafana
Grafana is a data visualization tool that works well with Prometheus and other data sources. It allows users to create custom dashboards and visualize metrics in real time.
Strengths:
- Provides capable data visualization capabilities.
- Supports a wide range of data sources, including Prometheus, Elasticsearch, and InfluxDB.
- Has a user-friendly interface for creating dashboards.
Weaknesses:
- Does not collect metrics itself; it relies on other tools like Prometheus.
Setup: To set up Grafana for Kubernetes monitoring, connect it to a Prometheus data source and import pre-built dashboards for Kubernetes. Customize the dashboards to show the metrics that are most relevant.
ELK Stack (Elasticsearch, Logstash, Kibana)
The ELK Stack is a popular log management and analysis solution. It consists of:
- Elasticsearch: A search and analytics engine for storing and analyzing logs.
- Logstash: A data processing pipeline for collecting, parsing, and transforming logs.
- Kibana: A visualization tool for exploring and visualizing logs stored in Elasticsearch.
Strengths:
- Provides capable log management and analysis capabilities.
- Supports a wide range of log sources and formats.
- Has a user-friendly interface for searching and exploring logs.
Weaknesses:
- Can be complex to set up and configure.
- Requires significant resources to run at scale.
Setup: To set up the ELK Stack for Kubernetes monitoring, deploy Elasticsearch, Logstash, and Kibana in the cluster. Configure Logstash to collect logs from Kubernetes containers and forward them to Elasticsearch. Use Kibana to create dashboards and explore the logs.
Comparison
- Ease of Use: Grafana is the easiest to use, with its user-friendly interface for creating dashboards. Prometheus requires some expertise to set up and configure, while the ELK Stack can be complex.
- Sizing: Prometheus and the ELK Stack are both sizable, but require careful planning and configuration to handle large volumes of data.
- Community Support: All three tools have large and active communities, providing ample documentation, tutorials, and support resources.
These open-source Kubernetes monitoring tools offer useful features for monitoring cluster performance and troubleshooting issues. Choosing the right tool depends on the specific needs and requirements.
“`
Prometheus: Metrics Collection and Monitoring
Prometheus is a top open-source monitoring solution often used for Kubernetes environments. It is designed to collect and store time-series data, providing a comprehensive view of cluster performance. Prometheus uses a pull-based model, where the Prometheus server periodically scrapes metrics from configured targets.
The Prometheus architecture includes:
- Prometheus server: The core component that scrapes, stores, and processes metrics.
- Exporters: Agents that expose metrics in a format that Prometheus can understand.
- Alertmanager: Handles alerts generated by Prometheus.
- PromQL: The query language used to analyze metrics data.
To configure Prometheus to collect metrics from Kubernetes components:
- Deploy the Prometheus server in the Kubernetes cluster.
- Use the Kubernetes service discovery feature to automatically discover nodes, pods, and containers.
- Configure Prometheus to scrape metrics from the discovered targets.
- Use exporters like
kube-state-metricsto expose Kubernetes-specific metrics.
PromQL is a capable query language that allows users to analyze metrics data. With PromQL, users can:
- Calculate rates and averages.
- Filter and aggregate metrics.
- Create alerts based on metric values.
For example, the following PromQL query calculates the average CPU usage for all pods in the default namespace:
rate(container_cpu_usage_seconds_total{namespace="default"}) Prometheus is used in real-world scenarios to monitor Kubernetes clusters by:
- Tracking resource utilization (CPU, memory, disk I/O).
- Monitoring application performance (request latency, error rates).
- Detecting anomalies and performance degradation.
Strengths of Prometheus include:
- Sizing: Can handle large volumes of data.
- Adaptability: Supports a wide range of exporters and integrations.
A weakness of Prometheus is the lack of built-in visualization. However, it integrates well with Grafana, which provides data visualization capabilities.
Prometheus is a key Kubernetes monitoring tool in the open-source ecosystem. Its ability to collect, store, and analyze time-series data makes it a valuable asset for monitoring Kubernetes clusters.
“`
Grafana: Data Visualization and Dashboarding
Grafana is a popular open-source data visualization tool that integrates with Prometheus and other data sources. It allows users to create dashboards to visualize Kubernetes metrics, offering insights into cluster performance. Grafana complements Prometheus by providing a user-friendly interface for exploring and analyzing the metrics collected by Prometheus.
To connect Grafana to Prometheus:
- Add Prometheus as a data source in Grafana.
- Configure the Prometheus data source with the URL of the Prometheus server.
- Test the connection to ensure that Grafana can access the Prometheus data.
Once connected, users can create dashboards to visualize Kubernetes metrics. Grafana supports different types of visualizations, including:
- Graphs: Line graphs, bar graphs, and heatmaps for visualizing time-series data.
- Charts: Pie charts and donut charts for visualizing proportions.
- Tables: For displaying tabular data.
- Gauges: For displaying single values within a range.
Many pre-built Grafana dashboards are available for Kubernetes monitoring. These dashboards provide a starting point for visualizing key metrics, such as CPU usage, memory consumption, and network traffic. Examples of pre-built dashboards include:
- Kubernetes Cluster Monitoring: Provides an overview of cluster health and performance.
- Node Exporter Full: Visualizes metrics from the Node Exporter, which collects system-level metrics from nodes.
- kube-state-metrics: Visualizes metrics from
kube-state-metrics, which exposes Kubernetes resource metrics.
Strengths of Grafana include:
- User-friendly interface: Easy to create and customize dashboards.
- Extensive plugin ecosystem: Supports a wide range of data sources and visualizations.
- Collaboration features: Allows users to share dashboards and collaborate on monitoring.
A weakness of Grafana is its reliance on external data sources. It does not collect metrics itself; it relies on tools like Prometheus to provide the data.
Grafana improves the capabilities of Kubernetes monitoring tools by providing capable visualization features. It allows users to gain insights into cluster performance and troubleshoot issues effectively.
“`
ELK Stack (Elasticsearch, Logstash, Kibana): Log Aggregation and Analysis
The ELK Stack (Elasticsearch, Logstash, Kibana) is a solution for log aggregation and analysis in Kubernetes. It provides a way to collect, process, and visualize log data from different components of the cluster. The ELK Stack helps users troubleshoot applications and identify issues.
The roles of each component are:
- Elasticsearch: A search and analytics engine that stores log data.
- Logstash: A data processing pipeline that collects, parses, and transforms logs.
- Kibana: A visualization tool that allows users to search, filter, and analyze log data stored in Elasticsearch.
To configure the ELK Stack to collect logs from Kubernetes components:
- Deploy Elasticsearch, Logstash, and Kibana in the Kubernetes cluster.
- Configure Logstash to collect logs from Kubernetes containers using a logging agent like Fluentd or Filebeat.
- Define Logstash pipelines to parse and transform the logs.
- Configure Kibana to connect to Elasticsearch and create dashboards for visualizing the log data.
Kibana allows users to:
- Search logs using a query language.
- Filter logs based on different criteria, such as timestamp, pod name, or log level.
- Analyze logs using aggregations and visualizations.
- Create dashboards to monitor application performance and identify issues.
For example, the ELK Stack can be used to troubleshoot Kubernetes applications by:
- Identifying error messages and stack traces in the logs.
- Tracking request latency and error rates.
- Monitoring application dependencies and external services.
Strengths of the ELK Stack include:
- Sizing: Can handle large volumes of log data.
- Adaptability: Supports a wide range of log sources and formats.
A weakness of the ELK Stack is its complexity. Setting up and configuring the ELK Stack can be challenging.
The ELK Stack complements other Kubernetes monitoring tools by providing capable log management capabilities. It allows users to gain insights into application behavior and troubleshoot issues effectively.
“`
Leading Commercial Kubernetes Monitoring Solutions
For organizations with complex requirements, commercial Kubernetes monitoring tools offer features and capabilities beyond those typically found in open-source solutions. These tools provide automated discovery, AI-driven insights, and enterprise-level support. Here are some prominent options:
Datadog
Datadog provides monitoring and analytics for cloud-scale applications. Its Kubernetes monitoring features include:
- Automated discovery of Kubernetes resources.
- Real-time dashboards and visualizations.
- Alerting and notifications.
- Integration with other DevOps tools.
Datadog also offers AI-driven insights, such as anomaly detection and root cause analysis.
New Relic
New Relic provides application performance monitoring (APM) and infrastructure monitoring. Its Kubernetes monitoring features include:
- Full-stack observability for Kubernetes environments.
- Automated instrumentation of applications.
- Real-time dashboards and analytics.
- Integration with other monitoring tools.
New Relic provides distributed tracing, which helps users track requests across multiple services.
Dynatrace
Dynatrace provides AI-driven monitoring for cloud-native applications. Its Kubernetes monitoring features include:
- Automated discovery of Kubernetes resources.
- Full-stack monitoring of applications and infrastructure.
- AI-driven insights and recommendations.
- Integration with other DevOps tools.
Dynatrace uses AI to automatically detect and resolve performance problems.
Comparison
These Kubernetes monitoring tools can be compared based on:
- Pricing: Datadog, New Relic, and Dynatrace all offer different pricing models based on usage and features.
- Sizing: All three tools are sizable and can handle large-scale Kubernetes deployments.
- Integration capabilities: Datadog, New Relic, and Dynatrace all integrate with a wide range of DevOps tools and cloud platforms.
These commercial Kubernetes monitoring tools simplify Kubernetes monitoring for organizations with complex requirements. They provide automated discovery, AI-driven insights, and enterprise-level support, making it easier to manage and optimize Kubernetes environments.
“`
Datadog: Comprehensive Monitoring and Analytics
Datadog is a commercial Kubernetes monitoring solution that provides monitoring and analytics for cloud-scale applications. It offers features such as automated discovery, real-time monitoring, and anomaly detection. Datadog integrates with Kubernetes to provide visibility into cluster performance.
Key features of Datadog include:
- Automated discovery: Automatically discovers Kubernetes resources, such as nodes, pods, and containers.
- Real-time monitoring: Provides real-time dashboards and visualizations of Kubernetes metrics.
- Anomaly detection: Uses machine learning to detect unusual activity and performance degradation.
- Alerting and notifications: Sends notifications when certain thresholds are breached.
- Integration with other DevOps tools: Integrates with tools like Slack, PagerDuty, and Jenkins.
Datadog integrates with Kubernetes by:
- Collecting metrics from Kubernetes components using the Datadog Agent.
- Using the Kubernetes API to discover resources and monitor their status.
- Providing dashboards and visualizations that are specific to Kubernetes.
For example, Datadog can be used to monitor Kubernetes environments by:
Strengths of Datadog include:
- Ease of use: Has a user-friendly interface for creating dashboards and configuring alerts.
- Extensive integrations: Integrates with a wide range of DevOps tools and cloud platforms.
A weakness of Datadog is its pricing. Datadog can be expensive for organizations with large-scale Kubernetes deployments.
Datadog simplifies Kubernetes monitoring for organizations with complex requirements. It provides automated discovery, real-time monitoring, and anomaly detection, making it easier to manage and optimize Kubernetes environments.
“`
New Relic: Full-Stack Observability
New Relic is a commercial Kubernetes monitoring solution that provides application performance monitoring (APM) and infrastructure monitoring. It delivers insights into the performance of Kubernetes applications and infrastructure through full-stack observability.
Key features of New Relic include:
- Full-stack observability: Monitors the performance of applications and infrastructure across the entire stack.
- Application performance monitoring (APM): Provides insights into application performance, such as response time, error rates, and transaction traces.
- Infrastructure monitoring: Monitors the performance of Kubernetes nodes, pods, and containers.
- Distributed tracing: Tracks requests across multiple services to identify performance bottlenecks.
- AI-driven insights: Uses AI to detect anomalies and provide recommendations for improving performance.
New Relic provides insights into the performance of Kubernetes applications and infrastructure by:
- Automatically instrumenting applications to collect performance data.
- Providing real-time dashboards and visualizations.
- Using AI to detect anomalies and provide recommendations.
For example, New Relic can be used to monitor Kubernetes deployments by:
- Tracking the performance of microservices.
- Identifying slow database queries.
- Monitoring the health of Kubernetes nodes and pods.
Strengths of New Relic include:
- Comprehensive feature set: Offers a wide range of monitoring and analytics capabilities.
- AI-driven insights: Uses AI to automatically detect and resolve performance problems.
A weakness of New Relic is its complexity. Setting up and configuring New Relic can be challenging.
New Relic improves Kubernetes monitoring tools by providing full-stack observability. It allows users to gain insights into the performance of applications and infrastructure, troubleshoot issues, and improve how it runs.
“`
Dynatrace: AI-Driven Monitoring and Automation
Dynatrace is a commercial Kubernetes monitoring solution that provides AI-driven monitoring and automation. It is designed to identify and resolve issues in Kubernetes environments in advance.
Key features of Dynatrace include:
- AI-driven monitoring: Uses AI to automatically detect anomalies and performance problems.
- Automated root cause analysis: Identifies the root cause of issues.
- Performance improvement: Provides recommendations for improving application performance.
- Full-stack monitoring: Monitors the performance of applications and infrastructure across the entire stack.
- Automated discovery: Automatically discovers Kubernetes resources, such as nodes, pods, and containers.
Dynatrace uses AI to identify and resolve issues in Kubernetes environments in advance by:
- Continuously learning the behavior of applications and infrastructure.
- Detecting anomalies and performance problems in real time.
- Automatically identifying the root cause of issues.
- Providing recommendations for resolving issues.
For example, Dynatrace can be used to monitor Kubernetes clusters by:
- Automatically detecting slow database queries.
- Identifying memory leaks in applications.
- Monitoring the health of Kubernetes nodes and pods.
Strengths of Dynatrace include:
- Automation capabilities: Automates many aspects of Kubernetes monitoring, such as discovery, alerting, and root cause analysis.
- AI-driven insights: Uses AI to automatically detect and resolve performance problems.
A weakness of Dynatrace is its cost. Dynatrace can be expensive for organizations with large-scale Kubernetes deployments.
Dynatrace automates Kubernetes monitoring and simplifies operations. It provides AI-driven insights and automation capabilities, making it easier to manage and improve Kubernetes environments.
“`
Best Practices for Implementing Kubernetes Monitoring
Implementing effective Kubernetes monitoring requires a strategic approach. These best practices help maintain a healthy and well-performing cluster. The use of Kubernetes monitoring tools is central to these practices.
- Define Key Performance Indicators (KPIs): Identify the metrics that are most important for the applications and the cluster. Common KPIs include CPU usage, memory consumption, network latency, and application response time. Defining KPIs helps focus monitoring efforts and prioritize issues.
- Set Up Alerts and Notifications: Configure alerts to trigger when KPIs exceed predefined thresholds. Use multiple notification channels, such as email, Slack, and PagerDuty, to ensure that alerts are received promptly. Customize alerts to minimize false positives and focus on critical issues.
- Automate Monitoring Tasks: Automate the deployment and configuration of monitoring agents and exporters. Use tools like Ansible, Chef, or Puppet to automate the setup of monitoring infrastructure. This reduces manual effort and ensures consistency across the cluster.
- Integrate Monitoring with CI/CD Pipelines: Integrate monitoring into the CI/CD pipeline to detect performance regressions early in the development process. Run performance tests as part of the CI/CD pipeline and use monitoring tools to analyze the results. This helps identify and resolve performance issues before they reach production.
- Optimize Resource Utilization: Use monitoring data to identify underutilized resources and reallocate them to other applications. Right-size Kubernetes deployments based on actual resource usage. This improves resource utilization and reduces costs.
- Troubleshoot Common Issues:
- High CPU usage: Identify the pods or nodes that are consuming the most CPU and investigate the cause.
- Memory leaks: Use memory profiling tools to identify memory leaks in applications.
- Network latency: Use network monitoring tools to identify network bottlenecks and latency issues.
By following these best practices, organizations can improve resource utilization, application performance, and overall system reliability. Kubernetes monitoring tools are vital for implementing these practices and maintaining a healthy Kubernetes environment.
“`
Defining Key Performance Indicators (KPIs) for Kubernetes Monitoring
Defining Key Performance Indicators (KPIs) is important for effective Kubernetes monitoring. KPIs provide a way to measure the health and performance of the cluster and applications. Without KPIs, it can be difficult to identify issues and track progress.
Examples of important KPIs include:
- CPU utilization: The percentage of CPU being used by pods and nodes.
- Memory usage: The amount of memory being used by pods and nodes.
- Network latency: The time it takes for data to travel between pods and nodes.
- Application response time: The time it takes for an application to respond to a request.
- Error rates: The number of errors occurring in applications.
To align KPIs with business goals and application requirements:
- Identify the key business objectives for the applications.
- Determine the metrics that are most relevant to those objectives.
- Set targets for each KPI based on the desired level of performance.
KPIs can be used to track progress and identify areas for improvement by:
- Creating dashboards that display KPIs in real time.
- Setting up alerts to trigger when KPIs exceed predefined thresholds.
- Analyzing historical data to identify trends and patterns.
Defining KPIs is a best practice for using Kubernetes monitoring tools effectively. It provides a way to measure the health and performance of the cluster and applications, track progress, and identify areas for improvement.
“`
Setting Up Effective Alerts and Notifications
Setting up alerts and notifications is a key aspect of Kubernetes monitoring. Alerts notify operators when issues arise, allowing them to take action before those problems escalate. Effective alerting minimizes downtime and maintains application performance.
To set up alerts effectively:
- Define thresholds for different metrics: Set limits for CPU usage, memory consumption, and other KPIs.
- Trigger alerts when thresholds are exceeded: Configure the monitoring tool to send notifications when a metric crosses a defined limit.
- Use multiple notification channels: Send alerts via email, Slack, PagerDuty, or other channels to ensure prompt delivery.
Common alert scenarios and how to respond:
- High CPU usage: Investigate the pods or nodes consuming the most CPU. Scale up resources or optimize application code.
- Low memory: Identify memory leaks in applications or increase memory limits for pods.
- Application errors: Examine application logs for error messages and stack traces. Deploy fixes or roll back to a stable version.
Minimizing false positives is important. Adjust alert thresholds to avoid triggering alerts for transient issues. Ensure that alerts are actionable by providing enough information to diagnose and resolve the problem.
Kubernetes monitoring tools should provide adaptable and customizable alerting capabilities. This allows users to define alerts that are specific to their environment and application requirements.
“`
Automating Kubernetes Monitoring Tasks
Automating Kubernetes monitoring tasks offers benefits. Automation improves efficiency, reduces errors, and frees up resources for other activities. By automating data collection, analysis, and reporting, organizations can focus on strategic initiatives.
Tasks that can be automated include:
- Data collection: Automate the deployment and configuration of monitoring agents and exporters.
- Analysis: Automate the analysis of monitoring data to identify trends, anomalies, and performance problems.
- Reporting: Automate the generation of reports on cluster health, application performance, and resource utilization.
Tools and techniques for automating monitoring tasks:
- Scripting: Use scripting languages like Python or Bash to automate tasks such as data collection and analysis.
- Configuration management: Use tools like Ansible, Chef, or Puppet to automate the configuration of monitoring infrastructure.
- Infrastructure-as-code: Use tools like Terraform or CloudFormation to automate the deployment of monitoring infrastructure.
Automation can improve efficiency by:
- Reducing manual effort.
- Improving consistency.
- Enabling faster response times.
Automation can reduce errors by:
- Eliminating manual configuration errors.
- Making sure that monitoring tasks are performed consistently.
Automation can free up resources for other tasks by:
- Reducing the time spent on routine monitoring tasks.
- Allowing operators to focus on strategic initiatives.
Automation is a best practice for maximizing the value of Kubernetes monitoring tools. By automating monitoring tasks, organizations can improve efficiency, reduce errors, and free up resources for other activities.
“`
Integrating Monitoring with CI/CD Pipelines
Integrating Kubernetes monitoring with CI/CD pipelines is important. This integration incorporates monitoring into the software development lifecycle to detect and resolve issues early. By using monitoring data to validate deployments and ensure application stability, organizations can improve the speed and reliability of software releases.
To integrate monitoring with CI/CD pipelines:
- Incorporate performance tests into the CI/CD pipeline.
- Use monitoring tools to analyze the results of performance tests.
- Set up alerts to trigger when performance regressions are detected.
- Automate the rollback of deployments when critical issues are identified.
Monitoring data can be used to validate deployments by:
- Tracking key performance indicators (KPIs) before and after a deployment.
- Comparing the performance of the new version with the previous version.
- Identifying any performance regressions or anomalies.
Integration with CI/CD pipelines can improve the speed and reliability of software releases by:
- Detecting and resolving issues early in the development process.
- Reducing the risk of deploying unstable code to production.
- Automating the rollback of deployments when critical issues are identified.
Kubernetes monitoring tools can be integrated with CI/CD tools to provide end-to-end visibility. This integration allows developers and operators to track the performance of applications throughout the entire software development lifecycle.
“`
Conclusion: Choosing the Right Kubernetes Monitoring Tools for Your Needs
Selecting the right Kubernetes monitoring tools is important for maintaining a healthy and efficient cluster. Throughout this article, different aspects of Kubernetes monitoring have been discussed, including key features, open-source solutions like Prometheus, Grafana, and the ELK Stack, and commercial platforms such as Datadog, New Relic, and Dynatrace.
Both open-source and commercial Kubernetes monitoring tools offer benefits. Open-source tools provide flexibility and cost-effectiveness, while commercial solutions offer automated discovery, AI-driven insights, and enterprise-level support. Readers should evaluate their options carefully based on their specific needs and requirements.
Kubegrade simplifies Kubernetes management and integrates well with various monitoring tools. It’s a platform for secure, adaptable, and automated K8s operations, enabling monitoring, upgrades, and optimization.
To improve your Kubernetes monitoring strategy, explore further resources, experiment with different tools, and implement the best practices discussed in this article. By taking these steps, you can ensure the health and performance of your Kubernetes environment.
“`

