





Kubernetes Tips and Tricks: Mastering K8s for Efficiency

by Tim
July 22, 2025
Kubernetes Tips and Tricks: K8s for Efficiency
Kubernetes (K8s) has become a cornerstone for orchestrating containerized applications, offering scalability and flexibility. However, realizing its full potential requires more than just basic setup. This article explores several Kubernetes tips and tricks to help optimize K8s deployments for performance, security, and efficiency. These insights aim to provide a more streamlined and effective K8s experience, whether one is managing a small project or a large-scale enterprise deployment.
By implementing best practices, users can fully utilize Kubernetes’ capabilities while avoiding common pitfalls. From optimizing resource allocation to enhancing security protocols and streamlining deployment processes, these tips and tricks serve as building blocks for better K8s. Let’s examine how to fine-tune K8s environments for smoother operations and better resource management, enabling applications to run at peak performance.
Key Takeaways
- Proper resource management with CPU and memory requests/limits prevents resource starvation and wastage.
- Liveness and readiness probes ensure traffic is routed only to healthy pods, improving application availability.
- Smaller, efficient container images lead to faster deployments and reduced resource consumption.
- RBAC restricts access to sensitive resources, preventing unauthorized changes.
- Network policies isolate applications and prevent unauthorized network traffic.
- Horizontal Pod Autoscaling (HPA) automatically adjusts pod replicas based on CPU/memory usage.
- Regularly scan container images for vulnerabilities to identify and address security issues.
Table of Contents
Introduction to Kubernetes Optimization
Kubernetes (K8s) has become a key tool for deploying applications [1]. Its ability to automate deployment, scaling, and management makes it a favorite for businesses [1]. This article provides Kubernetes tips and tricks to improve efficiency [2]. It will cover performance optimization, security, and strategies for scaling.
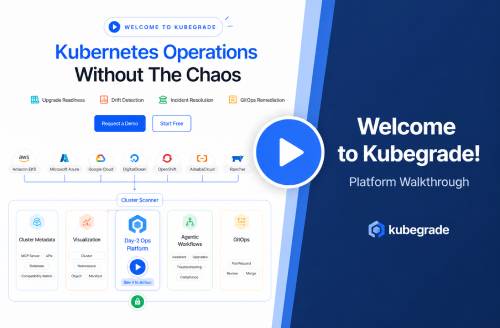
Managing Kubernetes can be complex. Kubegrade simplifies K8s cluster management, offering a platform for secure and automated operations that allows scaling. It helps with monitoring, upgrades, and optimization.
Top Kubernetes Performance Optimization Tips
Optimizing Kubernetes performance involves several key strategies. Here are some Kubernetes tips and tricks to help improve your deployments.
Resource Management
Proper resource management is crucial. It involves setting appropriate CPU and memory requests and limits for your containers. Resource requests specify the minimum resources a container needs, while limits set the maximum resources it can use. This prevents one container from hogging resources and starving others. For example:
apiVersion: v1kind: Podmetadata: name: resource-demospec: containers: - name: main image: nginx resources: requests: memory: "64Mi" cpu: "250m" limits: memory: "128Mi" cpu: "500m"In this example, the container requests 64MB of memory and 250mCPU, but it can use up to 128MB of memory and 500mCPU if available.
Liveness and Readiness Probes
Liveness probes detect when a container is running but unhealthy and needs to be restarted. Readiness probes determine when a container is ready to start accepting traffic. Configuring these probes correctly makes sure that traffic is only routed to healthy containers, improving overall application availability and performance. For instance:
apiVersion: v1kind: Podmetadata: name: probe-demospec: containers: - name: main image: nginx livenessProbe: httpGet: path: /healthz port: 80 initialDelaySeconds: 3 periodSeconds: 5 readinessProbe: httpGet: path: /readyz port: 80 initialDelaySeconds: 5 periodSeconds: 10This configuration checks the /healthz endpoint every 5 seconds to determine liveness and the /readyz endpoint every 10 seconds to check readiness.
Efficient Container Images
Smaller, efficient container images lead to faster deployment times and reduced resource consumption. Use multi-stage builds to include only the necessary components in your final image. For example, using a Dockerfile like this:
FROM golang:1.16 AS builderWORKDIR /appCOPY go.mod go.sum ./RUN go mod downloadCOPY . .RUN go build -o main .FROM alpine:latestWORKDIR /root/COPY --from=builder /app/main .EXPOSE 8080CMD ["./main"]This Dockerfile uses a builder stage to compile the Go application and then copies the binary to a smaller Alpine Linux image.
Monitoring Application Performance
Monitoring is key to identifying performance bottlenecks. Tools like Prometheus and Grafana allow you to collect and visualize metrics from your Kubernetes cluster. Set up dashboards to monitor CPU usage, memory consumption, and network traffic. Kubegrade can help monitor and optimize resource allocation, making sure your applications run efficiently.
By implementing these Kubernetes tips and tricks, you can significantly improve the performance of your Kubernetes deployments.
Resource Management: CPU and Memory
Effectively managing CPU and memory resources is crucial for optimizing Kubernetes performance. Kubernetes uses resource requests and limits to control how much CPU and memory each container can use. Resource requests specify the minimum amount of resources a container needs to function correctly. Limits define the maximum amount of resources a container is allowed to consume.
For example, consider a CPU-intensive application like a video encoding service. You might set the following resource requests and limits:
apiVersion: v1kind: Podmetadata: name: video-encoderspec: containers: - name: encoder image: video-encoder-image resources: requests: cpu: "1" memory: "2Gi" limits: cpu: "2" memory: "4Gi"Here, the container requests 1 CPU core and 2GiB of memory, but it can use up to 2 CPU cores and 4GiB of memory if available.
For a memory-intensive application like a caching service, you might configure:
apiVersion: v1kind: Podmetadata: name: cache-serverspec: containers: - name: cache image: cache-image resources: requests: cpu: "0.5" memory: "4Gi" limits: cpu: "1" memory: "8Gi"In this case, the container requests 0.5 CPU cores and 4GiB of memory, with a limit of 1 CPU core and 8GiB of memory.
Under-provisioning resources can lead to performance degradation and application instability. If a container doesn’t have enough CPU or memory, it may experience slowdowns, crashes, or out-of-memory errors. Over-provisioning wastes resources that could be used by other applications in the cluster. This can lead to inefficient resource utilization and increased costs.
Liveness and Readiness Probes: Making Sure Application Health
Liveness and readiness probes are crucial for monitoring application health in Kubernetes. They help make sure that traffic is routed only to healthy pods and that unhealthy pods are restarted. Knowing when to use each can significantly improve application availability and performance.
Liveness probes check if a container is running as expected. If a liveness probe fails, Kubernetes restarts the container. This is useful for recovering from deadlocks or other situations where the application is running but unable to make progress.
Readiness probes, check if a container is ready to serve traffic. If a readiness probe fails, Kubernetes stops sending traffic to the pod until it passes again. This is useful during application startup or when a pod is temporarily unable to handle requests.
Here?s an example of configuring an HTTP liveness probe:
apiVersion: v1kind: Podmetadata: name: http-probespec: containers: - name: main image: nginx livenessProbe: httpGet: path: /healthz port: 80 initialDelaySeconds: 3 periodSeconds: 5This probe checks the /healthz endpoint on port 80 every 5 seconds, with an initial delay of 3 seconds.
Here?s an example of configuring a TCP readiness probe:
apiVersion: v1kind: Podmetadata: name: tcp-probespec: containers: - name: main image: redis readinessProbe: tcpSocket: port: 6379 initialDelaySeconds: 5 periodSeconds: 10This probe checks if a TCP connection can be established on port 6379 every 10 seconds, with an initial delay of 5 seconds.
If a liveness probe fails, Kubernetes will restart the container, attempting to resolve the issue. If a readiness probe fails, Kubernetes will stop routing traffic to the pod, preventing users from experiencing issues with an unhealthy instance. Proper configuration of these probes is key for maintaining a healthy and responsive application.
Optimizing Container Images for Speed and Size
Efficient container images are key to good Kubernetes performance. Smaller and faster images reduce deployment times, decrease resource consumption, and improve overall efficiency. Here are some tips on how to optimize your container images.
Use Multi-Stage Builds: Multi-stage builds allow you to use multiple FROM statements in your Dockerfile. Each FROM instruction starts a new stage of the build, and you can selectively copy artifacts from one stage to another. This helps to include only the necessary components in your final image, reducing its size. For example:
FROM golang:1.16 AS builderWORKDIR /appCOPY go.mod go.sum ./RUN go mod downloadCOPY . .RUN go build -o main .FROM alpine:latestWORKDIR /root/COPY --from=builder /app/main .EXPOSE 8080CMD ["./main"]In this example, the first stage (builder) compiles the Go application, and the second stage (Alpine) copies only the compiled binary, resulting in a smaller final image.
Minimize Layers: Each instruction in a Dockerfile creates a new layer in the image. Reducing the number of layers can decrease the image size and improve build times. Combine multiple commands into a single RUN instruction using &&. For example, instead of:
RUN apt-get updateRUN apt-get install -y package1RUN apt-get install -y package2Use:
RUN apt-get update && apt-get install -y package1 package2Choose the Right Base Image: Selecting a minimal base image can significantly reduce the size of your container. Alpine Linux is a popular choice due to its small size (around 5MB). Other options include distroless images, which contain only the application and its runtime dependencies.
Analyze Image Size: Use tools like docker history to analyze the size of each layer in your image. This helps identify which layers are contributing the most to the image size and where optimizations can be made. For example:
docker history your-image:tagBy optimizing your container images, you can reduce deployment times and resource consumption, leading to improved Kubernetes performance.
Monitoring Application Performance with Prometheus and Grafana
Prometheus and Grafana are effective tools for monitoring application performance in Kubernetes. Prometheus collects metrics, and Grafana visualizes them, making it easier to identify performance bottlenecks and optimize resource allocation.
Setting up Prometheus: To collect metrics from Kubernetes pods and services, you first need to deploy Prometheus in your cluster. You can use the Prometheus Operator for easy deployment and management. Configure Prometheus to discover your Kubernetes resources by defining service monitors or pod monitors. For example:
apiVersion: monitoring.coreos.com/v1kind: ServiceMonitormetadata: name: example-service-monitor namespace: monitoringspec: selector: matchLabels: app: your-app endpoints: - port: http interval: 30sThis ServiceMonitor selects services with the label app: your-app and scrapes metrics from the http port every 30 seconds.
Creating Grafana Dashboards: Once Prometheus is collecting metrics, you can create Grafana dashboards to visualize key performance indicators (KPIs). Import pre-built dashboards or create your own to monitor CPU usage, memory consumption, request latency, and error rates. For example, you can create a dashboard that shows the CPU usage of your pods over time:
rate(container_cpu_usage_seconds_total{namespace="your-namespace", pod=~"your-app.*"}[5m])This PromQL query calculates the rate of CPU usage for pods matching the your-app pattern in the your-namespace namespace.
Identifying Performance Bottlenecks: Use Prometheus and Grafana to identify performance bottlenecks, such as high CPU usage, memory leaks, or slow response times. By monitoring these metrics, you can pinpoint the root cause of performance issues and take corrective actions, such as optimizing code, increasing resource allocations, or scaling your application.
By using Prometheus and Grafana, you can gain insights into your application’s performance and make data-driven decisions to optimize resource allocation and improve overall performance.
Key Kubernetes Security Best Practices

Securing Kubernetes deployments requires careful attention to several key areas. Neglecting these security measures can expose your cluster to various risks. Here are some Kubernetes tips and tricks to help you secure your deployments.
Role-Based Access Control (RBAC)
RBAC controls who can access Kubernetes resources and what actions they can perform. Implement RBAC to restrict access to sensitive resources and prevent unauthorized users from making changes. For example:
apiVersion: rbac.authorization.k8s.io/v1kind: Rolemetadata: namespace: default name: pod-readerrules:- apiGroups: [""] resources: ["pods"] verbs: ["get", "list"]---apiVersion: rbac.authorization.k8s.io/v1kind: RoleBindingmetadata: name: read-pods namespace: defaultsubjects:- kind: User name: jane@example.com apiGroup: rbac.authorization.k8s.ioroleRef: kind: Role name: pod-reader apiGroup: rbac.authorization.k8s.ioThis example grants jane@example.com read-only access to pods in the default namespace.
Network Policies
Network policies control the communication between pods. Use network policies to isolate applications and prevent unauthorized network traffic. For example:
apiVersion: networking.k8s.io/v1kind: NetworkPolicymetadata: name: deny-ingress namespace: defaultspec: podSelector: matchLabels: app: my-app policyTypes: - IngressThis network policy denies all ingress traffic to pods with the label app: my-app in the default namespace.
Pod Security Policies (PSPs) / Pod Security Standards (PSS)
Pod Security Policies (now deprecated in favor of Pod Security Standards) define security requirements for pods. Use PSPs/PSS to prevent pods from running with excessive privileges or using insecure configurations. For example, prevent pods from running as root or mounting host volumes.
Secrets Management
Properly manage secrets, such as passwords and API keys, to prevent unauthorized access. Use Kubernetes secrets to store sensitive information and encrypt them at rest. Avoid storing secrets in plain text in your configuration files or container images.
Regularly Scanning Container Images
Regularly scan container images for vulnerabilities using tools like Clair, Trivy, or Anchore. This helps identify and address security issues before they can be exploited. Update your base images and dependencies regularly to patch known vulnerabilities.
Securing the Kubernetes API Server
Secure the Kubernetes API server by enabling authentication and authorization, using TLS encryption, and limiting access to authorized users and services. Regularly audit API server logs to detect and respond to suspicious activity.
By implementing these Kubernetes tips and tricks, you can significantly improve the security of your Kubernetes deployments.
Role-Based Access Control (RBAC)
Role-Based Access Control (RBAC) is a method of securing Kubernetes clusters by regulating access to resources based on roles. It allows administrators to define who can access what resources and what actions they can perform. By implementing RBAC, you can minimize the risk of unauthorized access and data breaches.
Roles define the permissions within a specific namespace. Here’s an example of creating a role that grants read access to pods:
apiVersion: rbac.authorization.k8s.io/v1kind: Rolemetadata: namespace: default name: pod-readerrules:- apiGroups: [""] resources: ["pods"] verbs: ["get", "list"]Role Bindings assign roles to users, groups, or service accounts. Here’s an example of binding the pod-reader role to a user:
apiVersion: rbac.authorization.k8s.io/v1kind: RoleBindingmetadata: name: read-pods namespace: defaultsubjects:- kind: User name: jane@example.com apiGroup: rbac.authorization.k8s.ioroleRef: kind: Role name: pod-reader apiGroup: rbac.authorization.k8s.ioService Accounts provide an identity for processes that run in pods. Here’s an example of creating a service account and binding it to a role:
apiVersion: v1kind: ServiceAccountmetadata: namespace: default name: my-service-account---apiVersion: rbac.authorization.k8s.io/v1kind: RoleBindingmetadata: name: read-pods-sa namespace: defaultsubjects:- kind: ServiceAccount name: my-service-account namespace: defaultroleRef: kind: Role name: pod-reader apiGroup: rbac.authorization.k8s.ioLeast Privilege: The principle of least privilege states that users and service accounts should only have the minimum level of access required to perform their tasks. Implement this by creating specific roles with limited permissions and assigning them only to those who need them. Avoid granting cluster-admin privileges unless absolutely necessary.
Risks of Misconfigured RBAC: Misconfigured RBAC can lead to unauthorized access, data breaches, and privilege escalation. For example, granting excessive permissions to a service account could allow an attacker to compromise the entire cluster. Regularly review and audit your RBAC configurations to identify and address any potential issues.
Network Policies: Isolating Workloads
Network policies are key to isolating workloads within a Kubernetes cluster. They control communication between pods, preventing unauthorized access and limiting the impact of potential security breaches. By defining and applying network policies, you can segment your network and reduce the attack surface.
Defining Network Policies: Network policies are defined using YAML files and applied to specific namespaces. They use labels and selectors to specify which pods the policy applies to and what traffic is allowed or denied. For example, to deny all ingress traffic to pods with the label app: my-app in the default namespace, you can use the following network policy:
apiVersion: networking.k8s.io/v1kind: NetworkPolicymetadata: name: deny-ingress namespace: defaultspec: podSelector: matchLabels: app: my-app policyTypes: - IngressCommon Network Policy Scenarios: One common scenario is isolating frontend and backend services. For example, you can allow only the frontend pods to communicate with the backend pods, and deny all other traffic. Here’s an example:
apiVersion: networking.k8s.io/v1kind: NetworkPolicymetadata: name: frontend-to-backend namespace: defaultspec: podSelector: matchLabels: app: backend ingress: - from: - podSelector: matchLabels: app: frontendThis network policy allows ingress traffic to pods with the label app: backend only from pods with the label app: frontend.
Benefits of Network Segmentation: Network segmentation reduces the attack surface by limiting the scope of potential security breaches. If one pod is compromised, the attacker’s ability to move laterally within the cluster is restricted. This can help contain the damage and prevent attackers from gaining access to sensitive data or critical systems.
Secrets Management: Protecting Sensitive Data
Securely managing sensitive data, such as passwords, API keys, and certificates, is crucial for protecting Kubernetes deployments. Kubernetes secrets provide a way to store and manage this sensitive information. Proper secrets management prevents unauthorized access and reduces the risk of data breaches.
Kubernetes Secrets: Kubernetes secrets are objects that store sensitive data. You can create secrets using kubectl or by defining them in YAML files. Secrets can be used to store single values or multiple key-value pairs. For example:
apiVersion: v1kind: Secretmetadata: name: my-secret namespace: defaulttype: Opaquedata: username: $(echo -n 'admin' | base64) password: $(echo -n 'password123' | base64)This secret stores a username and password. Note that the values are base64 encoded.
Accessing Secrets: Pods can access secrets as environment variables or mounted as files. To access a secret as an environment variable:
apiVersion: v1kind: Podmetadata: name: my-podspec: containers: - name: my-container image: my-image env: - name: DB_USERNAME valueFrom: secretKeyRef: name: my-secret key: username - name: DB_PASSWORD valueFrom: secretKeyRef: name: my-secret key: passwordEncrypting Secrets: Encrypt secrets at rest to protect them from unauthorized access. Kubernetes supports encryption at rest using a KMS plugin or other encryption providers. Also, make sure to use TLS encryption for all communication between Kubernetes components to protect secrets in transit.
Risks of Exposing Secrets: Exposing secrets can have serious consequences, including unauthorized access to sensitive data, compromised systems, and data breaches. Avoid storing secrets in plain text in your configuration files, container images, or source code repositories. Regularly audit your deployments to identify and address any potential secret exposures.
Container Image Scanning: Identifying Vulnerabilities
Regularly scanning container images for vulnerabilities is a key practice for maintaining a secure Kubernetes environment. Vulnerable images can expose your applications to a wide range of security risks. Image scanning helps identify these vulnerabilities so you can address them before they are exploited.
How Image Scanning Works: Image scanning tools like Clair, Trivy, and Anchore analyze the layers of a container image to identify known vulnerabilities in the software packages and libraries included in the image. These tools compare the components in the image against vulnerability databases, such as the National Vulnerability Database (NVD), to identify potential security issues.
Types of Vulnerabilities Detected: Image scanning can detect various types of vulnerabilities, including:
- Known security flaws in software packages (e.g., CVEs)
- Outdated or unpatched software versions
- Misconfigurations that could expose the application to attack
- Embedded secrets or sensitive information
Automating Image Scanning: Automate image scanning as part of your CI/CD pipeline to ensure that all images are scanned before they are deployed to your Kubernetes cluster. Integrate image scanning tools into your build process so that vulnerabilities are detected early in the development lifecycle. For example, you can use a tool like Trivy in your Jenkins pipeline to scan images and fail the build if any high-severity vulnerabilities are found.
trivy image --severity HIGH --exit-code 1 your-image:tagRisks of Using Vulnerable Images: Using vulnerable images can expose your applications to a wide range of security risks, including:
- Data breaches
- Denial-of-service attacks
- Remote code execution
- Privilege escalation
Mitigate these risks by regularly scanning your images, patching vulnerabilities, and using minimal base images.
Strategies for Kubernetes Deployments That Can Scale
Achieving Kubernetes deployments that can handle increased load involves several strategies to make sure your applications can handle varying levels of traffic and resource demands. Here are some Kubernetes tips and tricks to help you scale effectively.
Horizontal Pod Autoscaling (HPA)
Horizontal Pod Autoscaling (HPA) automatically adjusts the number of pod replicas in a deployment based on observed CPU utilization, memory consumption, or custom metrics. HPA lets your application scale out to handle increased traffic without manual intervention. For example:
apiVersion: autoscaling/v2beta2kind: HorizontalPodAutoscalermetadata: name: my-app-hpaspec: scaleTargetRef: apiVersion: apps/v1 kind: Deployment name: my-app minReplicas: 2 maxReplicas: 10 metrics: - type: Resource resource: name: cpu target: type: Utilization averageUtilization: 70This HPA configuration scales the my-app deployment between 2 and 10 replicas, targeting an average CPU utilization of 70%.
Vertical Pod Autoscaling (VPA)
Vertical Pod Autoscaling (VPA) automatically adjusts the CPU and memory requests and limits of your containers based on observed resource usage. VPA can help optimize resource allocation and improve cluster utilization. However, VPA can be more disruptive than HPA, as it requires restarting pods to apply the new resource settings.
Optimizing Application Architecture
Optimizing your application architecture for scaling involves designing your application to be stateless and distributed. Use caching to reduce the load on your backend systems. Decompose your application into microservices to allow individual components to scale independently.
Load Balancing and Service Discovery
Load balancing distributes traffic across multiple instances of your application, preventing any single instance from becoming overloaded. Kubernetes services provide load balancing and service discovery within the cluster. Use ingress controllers to expose your services to external traffic.
Kubernetes Namespaces and Resource Quotas
Use Kubernetes namespaces to isolate different environments or teams within your cluster. Resource quotas limit the amount of resources that can be consumed by each namespace, preventing any single namespace from monopolizing cluster resources. This helps to maintain fair resource allocation in large-scale environments.
By implementing these Kubernetes tips and tricks, you can achieve Kubernetes deployments that can handle increased load and resource demands.
Horizontal Pod Autoscaling (HPA)
Horizontal Pod Autoscaling (HPA) is a Kubernetes feature that automatically adjusts the number of pod replicas in a deployment to match the current workload. HPA monitors metrics like CPU utilization, memory consumption, or custom metrics and scales the number of pods up or down based on predefined thresholds. This makes sure that your application can handle fluctuating workloads without manual intervention.
Configuring HPA: You can configure HPA using the Kubernetes API or kubectl. Here’s an example of creating an HPA that scales a deployment based on CPU utilization:
apiVersion: autoscaling/v2beta2kind: HorizontalPodAutoscalermetadata: name: my-app-hpaspec: scaleTargetRef: apiVersion: apps/v1 kind: Deployment name: my-app minReplicas: 2 maxReplicas: 10 metrics: - type: Resource resource: name: cpu target: type: Utilization averageUtilization: 70This HPA configuration scales the my-app deployment between 2 and 10 replicas, targeting an average CPU utilization of 70%. You can create this HPA using the following command:
kubectl apply -f hpa.yamlBenefits of HPA: HPA provides several benefits for handling fluctuating workloads, including:
- Automatic scaling based on real-time metrics
- Improved application availability and performance
- Reduced manual intervention and operational overhead
- Cost savings by scaling down during periods of low traffic
Setting Appropriate Scaling Thresholds: Setting appropriate scaling thresholds is crucial for effective HPA. If the thresholds are too low, the HPA may over-scale, resulting in wasted resources. If the thresholds are too high, the HPA may under-scale, leading to performance degradation. Monitor your application’s performance and adjust the thresholds accordingly to achieve optimal scaling behavior.
Vertical Pod Autoscaling (VPA)
Vertical Pod Autoscaling (VPA) automatically adjusts the CPU and memory resources allocated to pods based on their actual resource usage. Unlike Horizontal Pod Autoscaling (HPA), which scales the number of pod replicas, VPA changes the resource requests and limits of individual pods. VPA can help optimize resource utilization and improve the performance of your applications.
Modes of VPA: VPA has different modes of operation:
- Auto: VPA automatically adjusts the CPU and memory resources of pods and restarts them if necessary.
- Recreate: VPA recommends new CPU and memory resources, but requires manual intervention to restart the pods with the updated resources.
- Initial: VPA only sets the initial resource requests when the pod is created and does not update them afterward.
Benefits and Limitations of VPA: VPA offers several benefits, including:
- Automatic optimization of resource allocation
- Improved cluster utilization
- Reduced manual intervention
However, VPA also has some limitations:
- Can be more disruptive than HPA, as it requires restarting pods
- May not be suitable for all applications, especially those with strict uptime requirements
- Requires careful monitoring to avoid over- or under-provisioning resources
Using VPA to Optimize Resource Utilization: To use VPA, you need to deploy the VPA controller in your cluster and create a VPA object that targets your deployment. For example:
apiVersion: autoscaling.k8s.io/v1kind: VerticalPodAutoscalermetadata: name: my-app-vpaspec: targetRef: apiVersion: apps/v1 kind: Deployment name: my-app updatePolicy: updateMode: "Auto"This VPA configuration automatically adjusts the CPU and memory resources of the my-app deployment.
Load Balancing and Service Discovery
Load balancing and service discovery are key components of Kubernetes deployments that can scale. They make sure that traffic is distributed evenly across multiple instances of your application and that pods can easily locate and communicate with each other. Proper configuration of load balancing and service discovery is important for maintaining application availability and performance.
Load Balancing Options: Kubernetes offers several load balancing options:
- Kubernetes Services: A Kubernetes Service provides a stable IP address and DNS name for a set of pods. Services can be used to load balance traffic within the cluster. There are different types of Services, including ClusterIP, NodePort, and LoadBalancer.
- Ingress Controllers: An Ingress controller exposes your services to external traffic. It acts as a reverse proxy and load balancer, routing traffic to the appropriate services based on hostnames or paths.
Service Discovery: Service discovery enables pods to locate and communicate with each other without needing to know the IP addresses of individual pods. Kubernetes provides service discovery through DNS and environment variables. When a Service is created, Kubernetes automatically creates a DNS record for the Service, which pods can use to resolve the Service’s IP address.
Configuring Load Balancing and Service Discovery: Here’s an example of creating a Kubernetes Service:
apiVersion: v1kind: Servicemetadata: name: my-servicespec: selector: app: my-app ports: - protocol: TCP port: 80 targetPort: 8080This Service selects pods with the label app: my-app and forwards traffic on port 80 to port 8080 on the selected pods.
Here’s an example of configuring an Ingress:
apiVersion: networking.k8s.io/v1kind: Ingressmetadata: name: my-ingressspec: rules: - host: myapp.example.com http: paths: - path: / pathType: Prefix backend: service: name: my-service port: number: 80This Ingress routes traffic to myapp.example.com to the my-service Service on port 80.
Namespaces and Resource Quotas for Large-Scale Environments
In large-scale Kubernetes environments, namespaces and resource quotas are key for isolating resources and teams, improving organization, and making sure fair resource allocation. Namespaces provide a way to divide cluster resources between multiple users or teams, while resource quotas limit the amount of resources that each namespace can consume.
Using Namespaces for Organization and Security: Namespaces provide a logical separation of resources within a Kubernetes cluster. You can use namespaces to isolate different environments (e.g., development, staging, production), different teams, or different applications. This improves organization and security by limiting the scope of access and preventing resources in one namespace from interfering with resources in another namespace.
Using Resource Quotas to Limit Resource Consumption: Resource quotas limit the amount of resources that can be consumed by each namespace. You can set quotas for CPU, memory, storage, and other resources. This prevents any single namespace from monopolizing cluster resources and makes sure that all namespaces have access to the resources they need.
Configuring Namespaces and Resource Quotas: Here’s an example of creating a namespace:
apiVersion: v1kind: Namespacemetadata: name: my-namespaceYou can create this namespace using the following command:
kubectl apply -f namespace.yamlHere’s an example of creating a resource quota:
apiVersion: v1kind: ResourceQuotametadata: name: my-resource-quota namespace: my-namespacespec: hard: cpu: "4" memory: "8Gi" pods: "10"This resource quota limits the my-namespace namespace to 4 CPU cores, 8GiB of memory, and 10 pods. You can create this resource quota using the following command:
kubectl apply -f resource-quota.yamlConclusion: Kubernetes for Efficiency
This article covered several Kubernetes tips and tricks to help you achieve efficient Kubernetes deployments. By implementing these strategies, you can improve performance, improve security, and increase scalability.
We discussed how to optimize resource management using resource requests and limits, how to use liveness and readiness probes to make sure application health, and how to optimize container images for speed and size. We also covered key security best practices, such as implementing RBAC, using network policies, and managing secrets securely. Finally, we explored strategies for making your deployments that can handle increased load, including using HPA and VPA, load balancing, and service discovery.
By following these Kubernetes tips and tricks, you can take control of your Kubernetes environment and optimize it for efficiency. Take the next step and implement these tips in your own deployments. Consider exploring Kubegrade as a solution for simplifying Kubernetes management and automating many of these tasks.

