


Kubernetes Performance Monitoring: Tools, Metrics, and Best Practices

by Tim
September 2, 2025
Kubernetes performance monitoring is key for maintaining the health and efficiency of containerized applications. It provides insights into a cluster’s performance, allowing teams to identify and resolve issues before they impact users. Monitoring helps optimize resource allocation, making sure applications run smoothly and cost-effectively.
By tracking key metrics like CPU usage, memory consumption, and network traffic, organizations can actively manage their Kubernetes environment. This approach enables them to fine-tune infrastructure, improve application responsiveness, and provide a better user experience. With the right tools and practices, Kubernetes performance monitoring becomes a cornerstone of successful K8s operations.
Key Takeaways
- Kubernetes performance monitoring is crucial for maintaining application health and optimizing resource utilization in containerized environments.
- Key performance metrics to monitor include CPU utilization, memory usage, network I/O, and disk I/O at the pod, node, and cluster levels.
- Tools like Prometheus and Grafana (open-source) and various commercial platforms can be used for Kubernetes monitoring, each with its own benefits and drawbacks.
- Setting up alerts and notifications, establishing performance baselines, and automating monitoring tasks are essential best practices for effective Kubernetes performance monitoring.
- Regularly reviewing monitoring data and logs helps identify trends, patterns, and potential issues, enabling proactive troubleshooting and optimization.
- Kubegrade offers an integrated monitoring solution that simplifies Kubernetes cluster management and provides insights into cluster health and application performance.
Table of Contents
Introduction to Kubernetes Performance Monitoring
Kubernetes (K8s) is becoming the standard for container orchestration, as more organizations adopt it to manage their applications [1]. Kubernetes performance monitoring is the process of observing and analyzing the performance of applications and the Kubernetes infrastructure [1]. It is important for maintaining application health and optimizing resource use [1].
Effective monitoring directly affects application performance, reliability, and cost efficiency. This article will discuss key metrics, tools, and practices for Kubernetes performance monitoring.
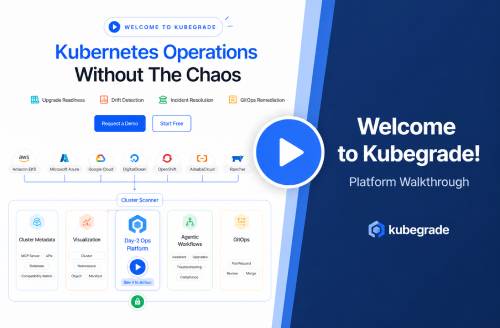
Kubegrade simplifies Kubernetes cluster management. It is a platform for secure and automated K8s operations. It also has monitoring capabilities.
Key Performance Metrics for Kubernetes
Monitoring key performance metrics is important in a Kubernetes environment. These metrics provide insights into resource use and application performance. Key metrics include CPU use, memory use, network I/O, and disk I/O [1]. These should be monitored at the pod, node, and cluster levels [1].
CPU Utilization
CPU utilization measures the amount of processing being used. High CPU use can indicate that a pod or node is under heavy load, which can slow down application performance. Monitoring CPU use can help identify when to scale resources or optimize applications [1].
Memory Usage
Memory use tracks the amount of RAM being used by pods and nodes. If a pod runs out of memory, it can crash, affecting application availability. Monitoring memory use helps ensure that applications have enough resources and to detect memory leaks [1].
Network I/O
Network I/O measures the amount of data being transferred in and out of pods and nodes. High network I/O can indicate network congestion or inefficient communication between services. Monitoring network I/O helps identify network bottlenecks and optimize network configurations [1].
Disk I/O
Disk I/O measures the rate at which data is being read from and written to disk. High disk I/O can slow down applications that rely on disk access. Monitoring disk I/O helps identify storage bottlenecks and optimize disk configurations [1].
Kubegrade can help visualize and track these metrics, providing a view of Kubernetes cluster performance.
CPU Utilization Monitoring
Monitoring CPU utilization is important for application performance in Kubernetes. It involves tracking CPU use at the pod, node, and cluster levels. Key metrics to monitor include CPU usage percentage and CPU throttling [1].
- Pod Level: Monitor the CPU usage of individual pods to identify CPU-intensive workloads. High CPU usage at the pod level may indicate that the application within the pod needs optimization or more CPU resources [1].
- Node Level: Track the CPU utilization of each node in the cluster. High CPU usage at the node level can indicate that the node is overloaded, potentially affecting all pods running on that node [1].
- Cluster Level: Monitor the overall CPU utilization of the entire cluster. This provides a view of the cluster’s capacity and helps in planning for scaling [1].
CPU throttling occurs when a pod’s CPU usage exceeds its allocated CPU limit. This can slow down the application and should be addressed by increasing the CPU limit for the pod [1].
To optimize CPU allocation, consider the following:
- Resource Requests and Limits: Set appropriate CPU requests and limits for each pod. Requests ensure that the pod is scheduled on a node with enough CPU resources, while limits prevent the pod from using more CPU than allocated [1].
- Horizontal Pod Autoscaling (HPA): Use HPA to automatically scale the number of pods based on CPU utilization. This makes sure that applications have enough CPU resources during peak loads [1].
- Application Optimization: Optimize applications to reduce CPU usage. This can involve code changes, caching, or using more efficient algorithms [1].
Memory Usage Analysis
Monitoring memory use is important for the stability and performance of applications in Kubernetes. Key metrics to monitor include Resident Set Size (RSS), cache use, and swap use [1].
- Resident Set Size (RSS): The amount of physical memory a process is using. Monitoring RSS helps understand the actual memory footprint of a pod [1].
- Cache Usage: The amount of memory used for caching data. High cache use can indicate that an application is caching a lot of data, which can be good or bad depending on the application’s design [1].
- Swap Usage: The amount of memory being swapped to disk. Swap use indicates that the system is running out of physical memory, which can slow down performance [1].
Memory leaks and excessive memory consumption can negatively affect application performance. Memory leaks occur when an application fails to release memory that it no longer needs, leading to increased memory use over time. Excessive memory consumption can occur when an application uses more memory than expected, potentially causing it to crash or slow down [1].
Strategies for identifying and resolving memory-related issues include:
- Profiling: Use profiling tools to identify memory leaks and excessive memory consumption in applications [1].
- Setting Memory Limits and Requests: Set appropriate memory limits and requests for containers to prevent them from using more memory than allocated. Memory requests ensure that a pod is scheduled on a node with enough memory, while memory limits prevent a pod from using more memory than available [1].
- Monitoring: Continuously monitor memory use to detect and address memory-related issues.
Network I/O Monitoring
Monitoring network I/O is important for application performance and identifying network-related issues in Kubernetes. It involves tracking network traffic at the pod and node levels. Key metrics to monitor include network traffic volume, packet loss, and latency [1].
- Pod Level: Monitor the network traffic of individual pods to identify network-intensive applications. High network traffic at the pod level may indicate the need for optimization or increased network resources [1].
- Node Level: Track the network I/O of each node in the cluster. High network I/O at the node level can indicate that the node is experiencing network congestion, potentially affecting all pods running on that node [1].
Interpreting network I/O metrics:
- Network Traffic Volume: Measures the amount of data being transferred in and out of pods and nodes. High traffic volume can indicate network congestion or inefficient communication between services [1].
- Packet Loss: Indicates the percentage of packets that are lost during transmission. High packet loss can result in slow application performance and connectivity issues [1].
- Latency: Measures the time it takes for data to travel between two points. High latency can slow down application performance and affect user experience [1].
To optimize network configurations, consider the following:
- Network Policies: Implement network policies to control traffic flow between pods and limit network access to services [1].
- Service Meshes: Use service meshes to manage and secure communication between services, providing features such as traffic management, load balancing, and encryption [1].
- DNS Configuration: Optimize DNS configuration to reduce latency and improve service discovery [1].
Disk I/O Monitoring
Monitoring disk I/O is important for application performance in Kubernetes. Slow disk performance can affect application responsiveness. Key metrics to monitor include disk read/write operations, disk latency, and disk utilization [1].
- Disk Read/Write Operations: Measures the rate at which data is being read from and written to disk. High read/write operations can indicate that an application is disk-intensive [1].
- Disk Latency: Measures the time it takes for a disk operation to complete. High disk latency can slow down application performance [1].
- Disk Utilization: Indicates the percentage of disk capacity being used. High disk utilization can lead to performance issues [1].
Strategies for identifying and resolving disk-related issues include:
- Identifying Disk-Intensive Pods: Determine which pods are generating the most disk I/O [1].
- Analyzing Storage Configurations: Review storage configurations to identify potential bottlenecks [1].
- Optimizing Disk Performance: Optimize disk performance by using faster storage devices, such as SSDs, or by implementing caching mechanisms [1].
Tips for optimizing storage configurations:
- Use SSDs: Solid-state drives (SSDs) offer faster performance compared to traditional hard disk drives (HDDs) [1].
- Implement Caching: Use caching mechanisms to reduce the number of disk operations required [1].
- Optimize File Systems: Choose the right file system for the workload. Some file systems are optimized for read-intensive workloads, while others are optimized for write-intensive workloads [1].
Tools for Kubernetes Monitoring

Several tools are available for Kubernetes performance monitoring, each with its own features, benefits, and drawbacks. These tools help in observing the health and performance of Kubernetes clusters and the applications running on them.
Open-Source Solutions
- Prometheus: An open-source monitoring solution that collects metrics from Kubernetes clusters. It is suited for environments that change often due to its pull-based model [1].
- Grafana: An open-source data visualization tool that works with Prometheus to create dashboards and visualize metrics. Grafana allows users to create custom dashboards to monitor specific aspects of their Kubernetes clusters [1].
Commercial Platforms
Several commercial platforms offer Kubernetes monitoring capabilities. These platforms often provide additional features such as alerting, log management, and security monitoring.
Choosing the right tool depends on specific needs and budget. Open-source solutions like Prometheus and Grafana are for those who want a customizable and cost-effective solution. Commercial platforms offer features and support, but at a higher cost.
Real-world examples of how these tools are used:
- Monitoring Application Performance: Prometheus and Grafana can be used to monitor the CPU use, memory use, and network I/O of individual pods, helping identify performance bottlenecks [1].
- Tracking Cluster Health: These tools can also be used to track the health of the entire Kubernetes cluster, including the status of nodes, pods, and services [1].
Open-Source Monitoring Tools: Prometheus and Grafana
Prometheus and Grafana are open-source tools often used together for Kubernetes monitoring. Prometheus collects and stores metrics, while Grafana visualizes them [1].
Prometheus
Prometheus collects metrics from Kubernetes components, applications, and infrastructure. It uses a pull-based model, where it scrapes metrics endpoints at regular intervals. Prometheus stores metrics in a time-series database, which is optimized for storing and querying time-stamped data [1].
Grafana
Grafana is a data visualization tool that allows users to create dashboards and visualize metrics collected by Prometheus. Grafana supports a variety of data sources, including Prometheus, and provides a user-friendly interface for creating custom dashboards [1].
Benefits:
- Cost-Effectiveness: Prometheus and Grafana are open-source and free to use [1].
- Community Support: They have large and active communities, providing support and resources [1].
Drawbacks:
- Complexity of Setup: Setting up and configuring Prometheus and Grafana can be complex [1].
- Maintenance Overhead: Maintaining these tools requires effort and expertise [1].
Integration:
To integrate Prometheus and Grafana effectively:
- Configure Prometheus to scrape metrics from Kubernetes components and applications [1].
- Create Grafana dashboards to visualize the metrics collected by Prometheus [1].
- Use Prometheus queries to extract and analyze data [1].
Commercial Kubernetes Monitoring Platforms
Several commercial platforms offer Kubernetes monitoring capabilities. These platforms often provide features, ease of use, and support compared to open-source solutions.
Benefits:
- Ease of Use: Commercial platforms typically offer user-friendly interfaces and automated setup processes [1].
- Advanced Analytics: Many commercial platforms provide advanced analytics capabilities, such as anomaly detection and predictive analytics [1].
- Dedicated Support: Commercial platforms offer dedicated support, which can be for organizations that lack in-house expertise [1].
Drawbacks:
- Cost: Commercial platforms can be expensive, especially for large Kubernetes clusters [1].
- Vendor Lock-In: Using a commercial platform can result in vendor lock-in, making it difficult to switch to another solution [1].
Key Considerations:
When choosing a commercial platform, consider the following:
- Metrics Collection: Ensure that the platform collects all the metrics needed to monitor the performance of Kubernetes clusters and applications [1].
- Visualization: Choose a platform that offers visualization capabilities, such as dashboards and graphs [1].
- Alerting: Select a platform that provides alerting capabilities, allowing to receive notifications when performance issues occur [1].
- Integration: Ensure that the platform integrates with other tools, such as logging and security monitoring solutions [1].
Kubegrade’s Integrated Monitoring Solution
Kubegrade provides built-in monitoring features that simplify Kubernetes performance monitoring. It offers a view of cluster health, resource use, and application performance.
Kubegrade’s integrated solution offers several benefits compared to standalone tools:
- Ease of Use: Kubegrade’s monitoring features are designed to be user-friendly, making it easy to set up and use [1].
- Integration: Kubegrade’s monitoring solution is integrated with its other features, providing a view of Kubernetes cluster management [1].
- Issue Resolution: Kubegrade’s monitoring capabilities help users identify and resolve performance issues [1].
Examples of how Kubegrade’s monitoring capabilities can help:
- Identifying Resource Bottlenecks: Kubegrade can help identify resource bottlenecks, such as high CPU use or memory use, allowing users to optimize resource allocation [1].
- Detecting Application Issues: Kubegrade can detect application issues, such as slow response times or errors, allowing users to troubleshoot and resolve problems [1].
Best Practices for Effective Kubernetes Performance Monitoring
Setting up and maintaining effective Kubernetes performance monitoring involves implementing practices that ensure the health and performance of applications and the Kubernetes infrastructure. These practices include setting up alerts and notifications, establishing baselines, automating monitoring tasks, and reviewing monitoring data [1].
- Set Up Alerts and Notifications: Configure alerts and notifications to receive alerts when performance issues occur. This allows to respond quickly to problems and prevent them from affecting application performance [1].
- Establish Baselines: Establish baselines for key performance metrics to identify deviations from normal behavior. Baselines provide a reference point for comparing current performance to historical performance [1].
- Automate Monitoring Tasks: Automate monitoring tasks to reduce manual effort and ensure that monitoring is performed consistently. Automation can involve using tools to collect metrics, analyze data, and generate reports [1].
- Review Monitoring Data: Review monitoring data regularly to identify trends and patterns. This can help anticipate performance issues and optimize resource allocation [1].
Troubleshooting Common Performance Issues:
- Identify the Source of the Problem: Determine whether the issue is related to the application, the Kubernetes infrastructure, or the network [1].
- Analyze Metrics: Analyze metrics to identify the root cause of the problem. This can involve looking at CPU use, memory use, network I/O, and disk I/O [1].
- Take Corrective Action: Take action to resolve the problem. This can involve optimizing applications, scaling resources, or reconfiguring the Kubernetes infrastructure [1].
Setting Up Alerts and Notifications
Configuring alerts and notifications for performance metrics is important for responding to issues in Kubernetes. Alerts notify when metrics exceed defined thresholds, allowing for quick action [1].
Types of Alerts:
- CPU Usage: Alert when CPU use exceeds a threshold, indicating a CPU-bound workload [1].
- Memory Usage: Alert when memory use exceeds a threshold, indicating a memory leak or excessive memory consumption [1].
- Network Latency: Alert when network latency exceeds a threshold, indicating a network issue [1].
Best Practices for Routing Alerts:
- Identify the Right Teams: Route alerts to the teams responsible for the affected applications or infrastructure [1].
- Use Multiple Channels: Use multiple channels, such as email, Slack, or PagerDuty, to ensure that alerts are received [1].
- Set Severity Levels: Set severity levels for alerts to prioritize critical issues [1].
Examples of Alerting Tools and Platforms:
- Prometheus Alertmanager: An alerting tool that works with Prometheus to send alerts based on defined rules [1].
- Commercial Monitoring Platforms: Many commercial monitoring platforms offer alerting capabilities, such as Datadog and New Relic [1].
Establishing Performance Baselines
Establishing performance baselines is important for detecting anomalies and performance regressions in Kubernetes applications. Baselines represent the normal operating ranges for key performance metrics, providing a reference point for comparing current performance to historical performance [1].
To establish performance baselines:
- Collect Historical Data: Collect historical performance data for key metrics, such as CPU use, memory use, network I/O, and disk I/O [1].
- Identify Normal Ranges: Analyze the historical data to identify normal operating ranges for each metric [1].
- Set Thresholds: Set thresholds for each metric based on the normal operating ranges. These thresholds will be used to detect anomalies and performance regressions [1].
Using Baselines to Optimize Resource Allocation and Capacity Planning:
- Identify Underutilized Resources: Baselines can help identify underutilized resources, such as CPU or memory, allowing to reduce resource allocation and save costs [1].
- Plan Capacity: Baselines can help plan capacity by providing insights into how resource use changes over time [1].
Automating Monitoring Tasks
Automating routine monitoring tasks in Kubernetes improves efficiency and reduces manual effort. Automation makes sure that monitoring is performed consistently and allows to focus on other tasks [1].
Tools for Automating Monitoring Tasks:
- CronJobs: Use CronJobs to schedule tasks that run at specific intervals, such as collecting metrics or generating reports [1].
- Operators: Use Operators to automate the management of complex applications and infrastructure components, including monitoring configurations [1].
Benefits of Infrastructure-as-Code (IaC) for Managing Monitoring Configurations:
- Version Control: IaC allows to manage monitoring configurations using version control, providing a history of changes and the ability to roll back to previous versions [1].
- Automation: IaC enables to automate the deployment and configuration of monitoring infrastructure, reducing manual effort and making sure of consistency [1].
Examples of Automating Common Monitoring Workflows:
- Collecting Metrics: Automate the collection of metrics from Kubernetes components and applications using Prometheus and other tools [1].
- Analyzing Data: Automate the analysis of monitoring data to identify trends and patterns [1].
- Generating Reports: Automate the generation of monitoring reports to provide insights into the health and performance of Kubernetes clusters [1].
Regularly Reviewing Monitoring Data and Logs
Regularly reviewing monitoring data and logs is important for identifying trends, patterns, and potential issues in Kubernetes environments. Analyzing data and logs provides insights into application performance and helps to anticipate problems [1].
Using Monitoring Dashboards and Log Analysis Tools:
- Monitoring Dashboards: Use monitoring dashboards to visualize key performance metrics and identify deviations from normal behavior [1].
- Log Analysis Tools: Use log analysis tools to search and analyze logs, identify errors, and troubleshoot issues [1].
Benefits of Monitoring and Continuous Optimization:
- Early Issue Detection: Monitoring helps detect issues before they affect application performance [1].
- Improved Performance: Continuous optimization improves application performance and resource use [1].
Tips for Troubleshooting Common Performance Issues Based on Monitoring Data and Logs:
- Identify the Source of the Problem: Determine whether the issue is related to the application, the Kubernetes infrastructure, or the network [1].
- Analyze Metrics and Logs: Analyze metrics and logs to identify the root cause of the problem [1].
- Take Corrective Action: Take action to resolve the problem [1].
Conclusion: Optimizing Kubernetes Performance with Monitoring
Kubernetes performance monitoring is important for application health and optimizing resource use. This article discussed key metrics, tools, and practices for effective monitoring.
Main points:
- Key Metrics: Monitor CPU use, memory use, network I/O, and disk I/O at the pod, node, and cluster levels [1].
- Tools: Use open-source solutions like Prometheus and Grafana, or commercial platforms, for monitoring [1].
- Best Practices: Set up alerts, establish baselines, automate tasks, and review data [1].
Kubegrade simplifies Kubernetes cluster management and provides monitoring capabilities. By implementing the strategies discussed, users can improve their Kubernetes environment’s performance and reliability.
Explore Kubegrade’s features for improved Kubernetes management.

